Apica Grafana Plugin
![]()
The Apica Grafana Plugin enables integrating Apica with Grafana to proactively monitor your websites around the clock, along with applications and APIs, to identify availability and performance issues before they impact customers. https://www.apica.io/
- Apica Grafana Plugin
- Supported Grafana Versions
- Installation and Configuration Instructions
- Dashboards
- Template Variables
- Ad hoc filter
- Query Editor Options
- Annotations
- How to Build and Configure Dashboards
Supported Grafana Versions
- Grafana 8.x
Installation and Configuration Instructions
Step 1: Download and install the plugin
Download and unzip the plugin under your grafana plugins directory
unzip apica-2.0.12.zip -d YOUR_GRAFANA_PLUGIN_DIR/apica
Setup Plugin
Note: Since this is Apica’s private plugin, it must remain “unsigned” per Grafana’s plugin policy. Contact Apica support directly with any questions.
Restart Grafana
Step 2: Add ASM Datasource to Grafana
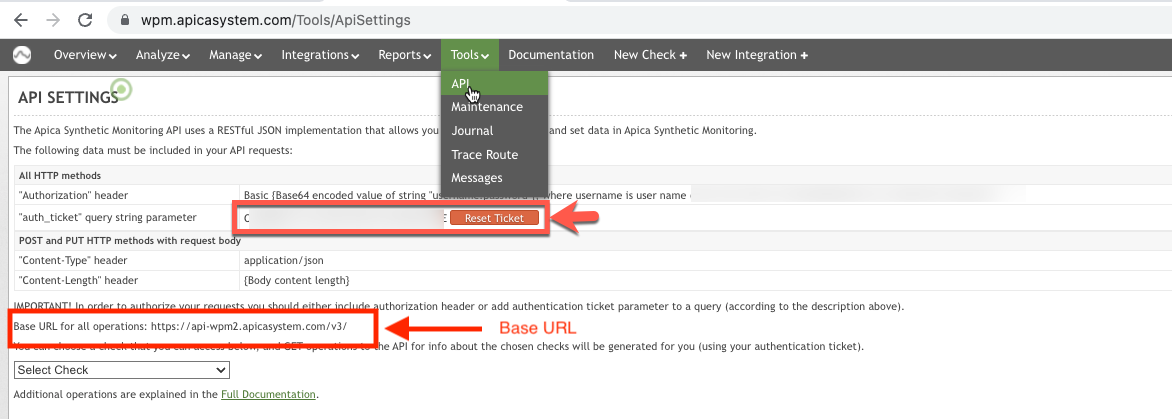
- Copy your Authentication Token from https://wpm.apicasystem.com/Tools/ApiSettings
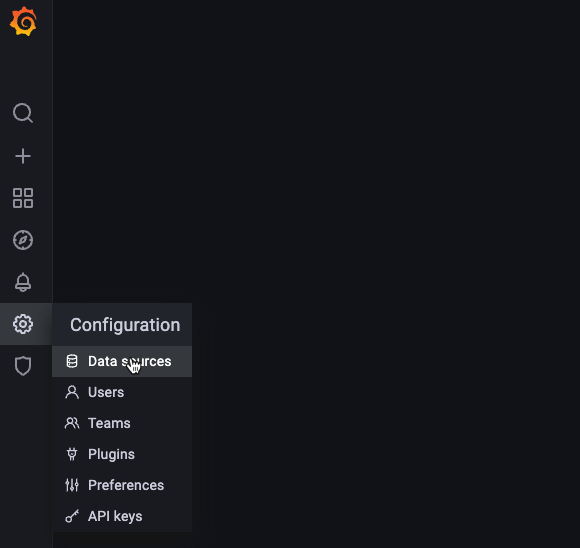
- Open Grafana Configurations-> Data Source
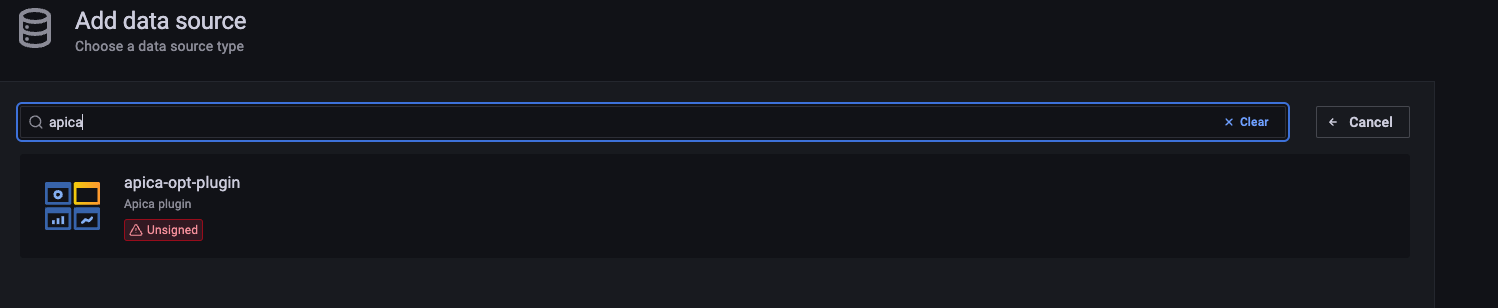
- Add Apica datasource to grafana
-
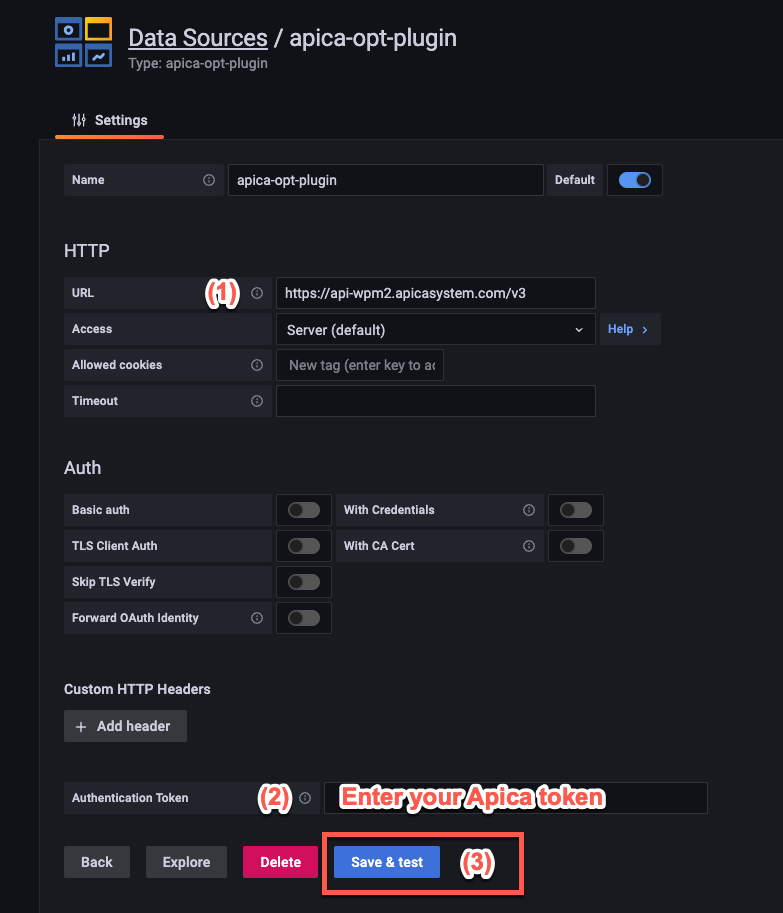
Enter the API base URL for your ASM account visible in step 1.
- Enter your Authentication Token for the Apica API you copied in step 1
Step 3: Import Grafana Dashboard Templates
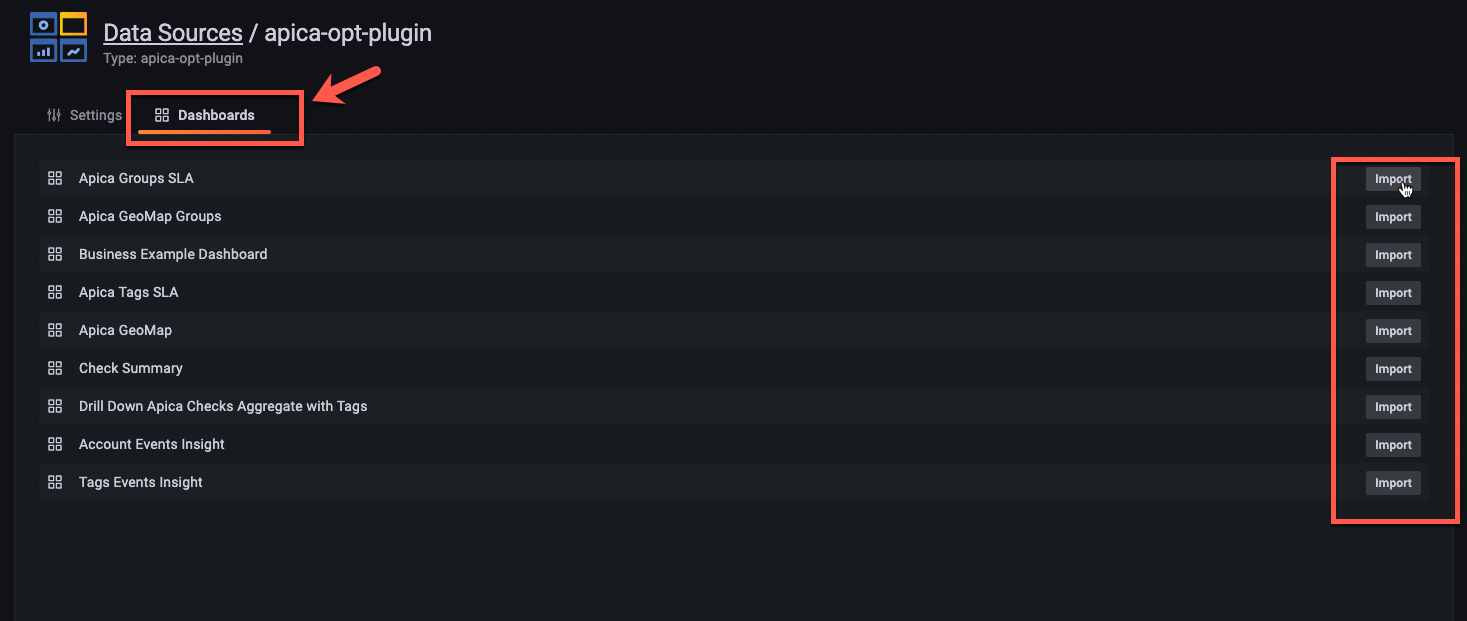
Dashboards
The apica grafana plugin is shipped with below out of the box dashboards that are available to support visualizing data based on tags, group, check, or account level:
- Tag Level Dashboards
- Group Level Dashboards
- Account Level Dashboards
- Sample Business Dashboard
Apica Tags SLA
Dynamic Dashboard to show aggregate SLA by selected tags from the dropdown list.
- Allows the team to customize the dashboard to view tags related to them or to focus on business critical checks.
- Drill down on the impacted tag SLA to view checks details associated with the selected tag
- Show custom events associated with the selected tags
- Drill down into check summary dashboard
- Group by selected tag key
- adhoc filter to filter results using spefic tag value
Apica Drill Down Checks Aggregate with Tags
Dynamic Dashboard to show aggregate SLA for selected checks
- Dashboard can be filtered by tags and checks
- Show custom event associated with selected check
- This dashboard is being used a drilldown dashboard from the Apica Tags SLA
- Drilldown into Apica Check Summary by clicking on the Check SLA widget
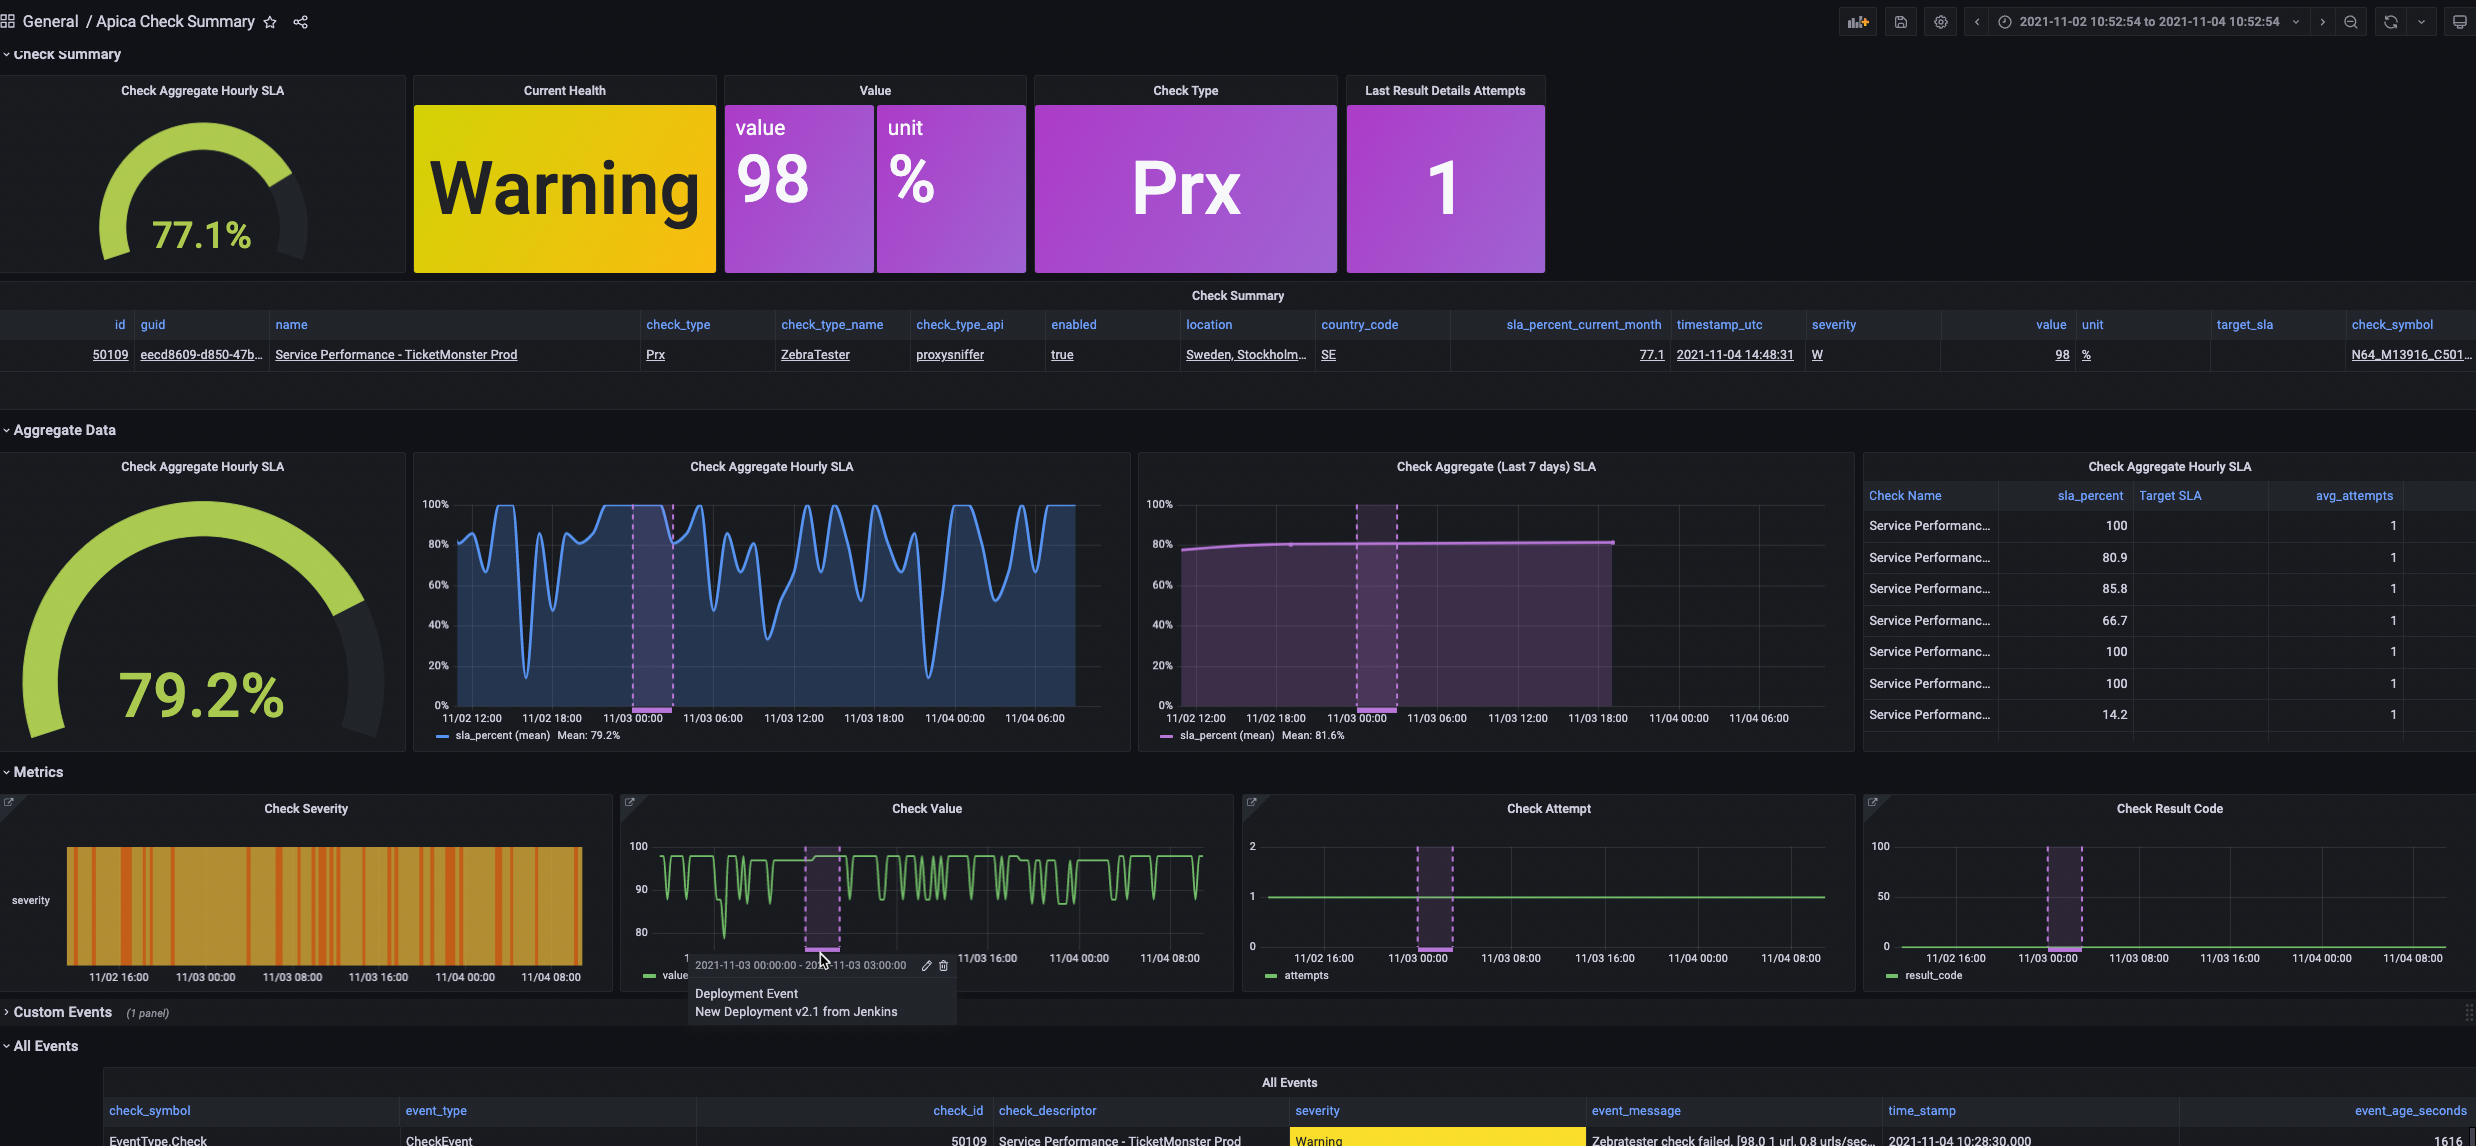
Apica Check Summary
Dynamic Dashboard to show health status and key KPIs for selected check(s) from the dropdown list
- Dashboard can be filtered by tags and checks
- Show custom event associated with selected check
- Show Annotation in the charts based on custom events
- Dynamic Drill down into Check Details in the Apica System
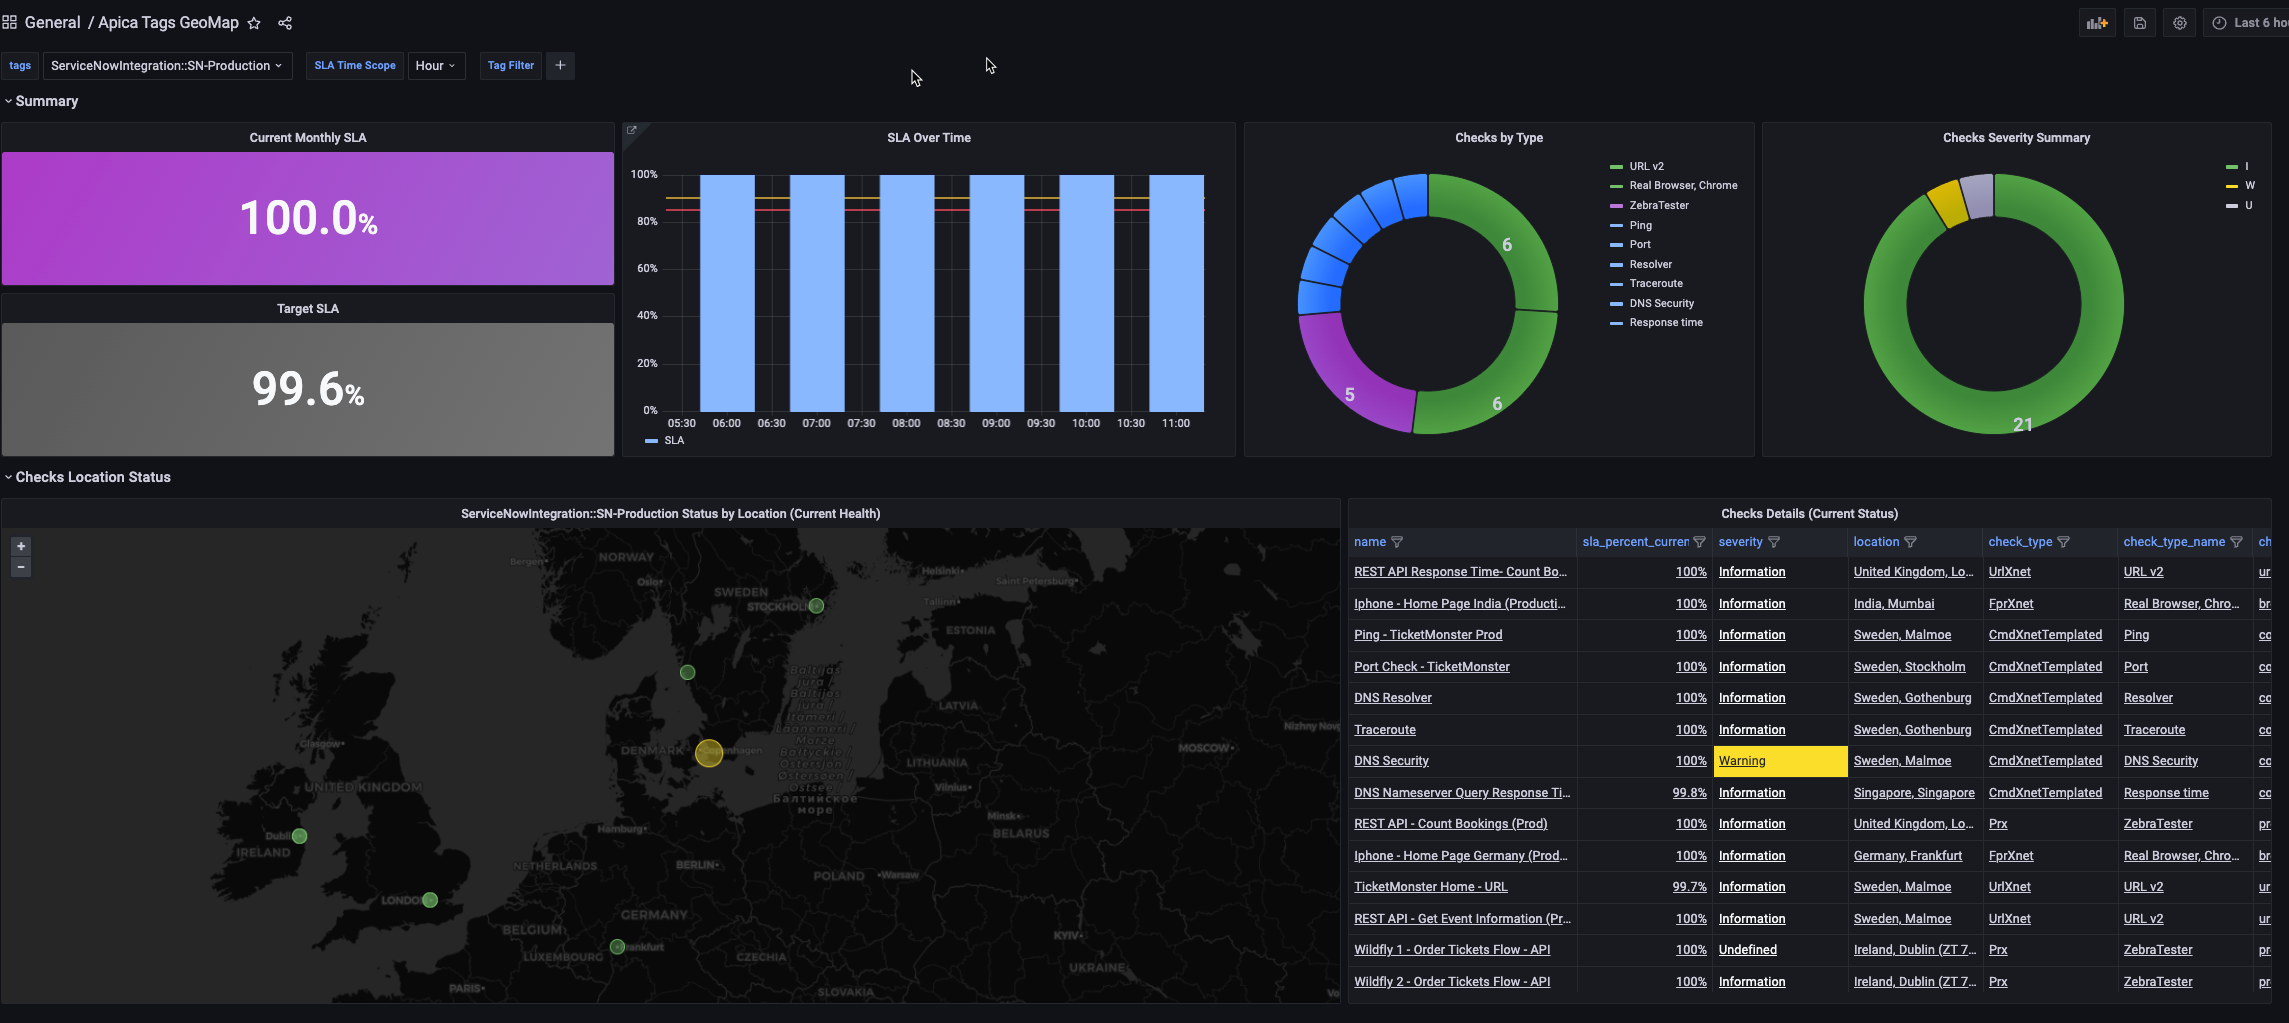
Apica Tags Geo Map
View checks health status by geo location for selected Tag
- Drill down into Apica systems for check details
- Summary of check types for the selected tag
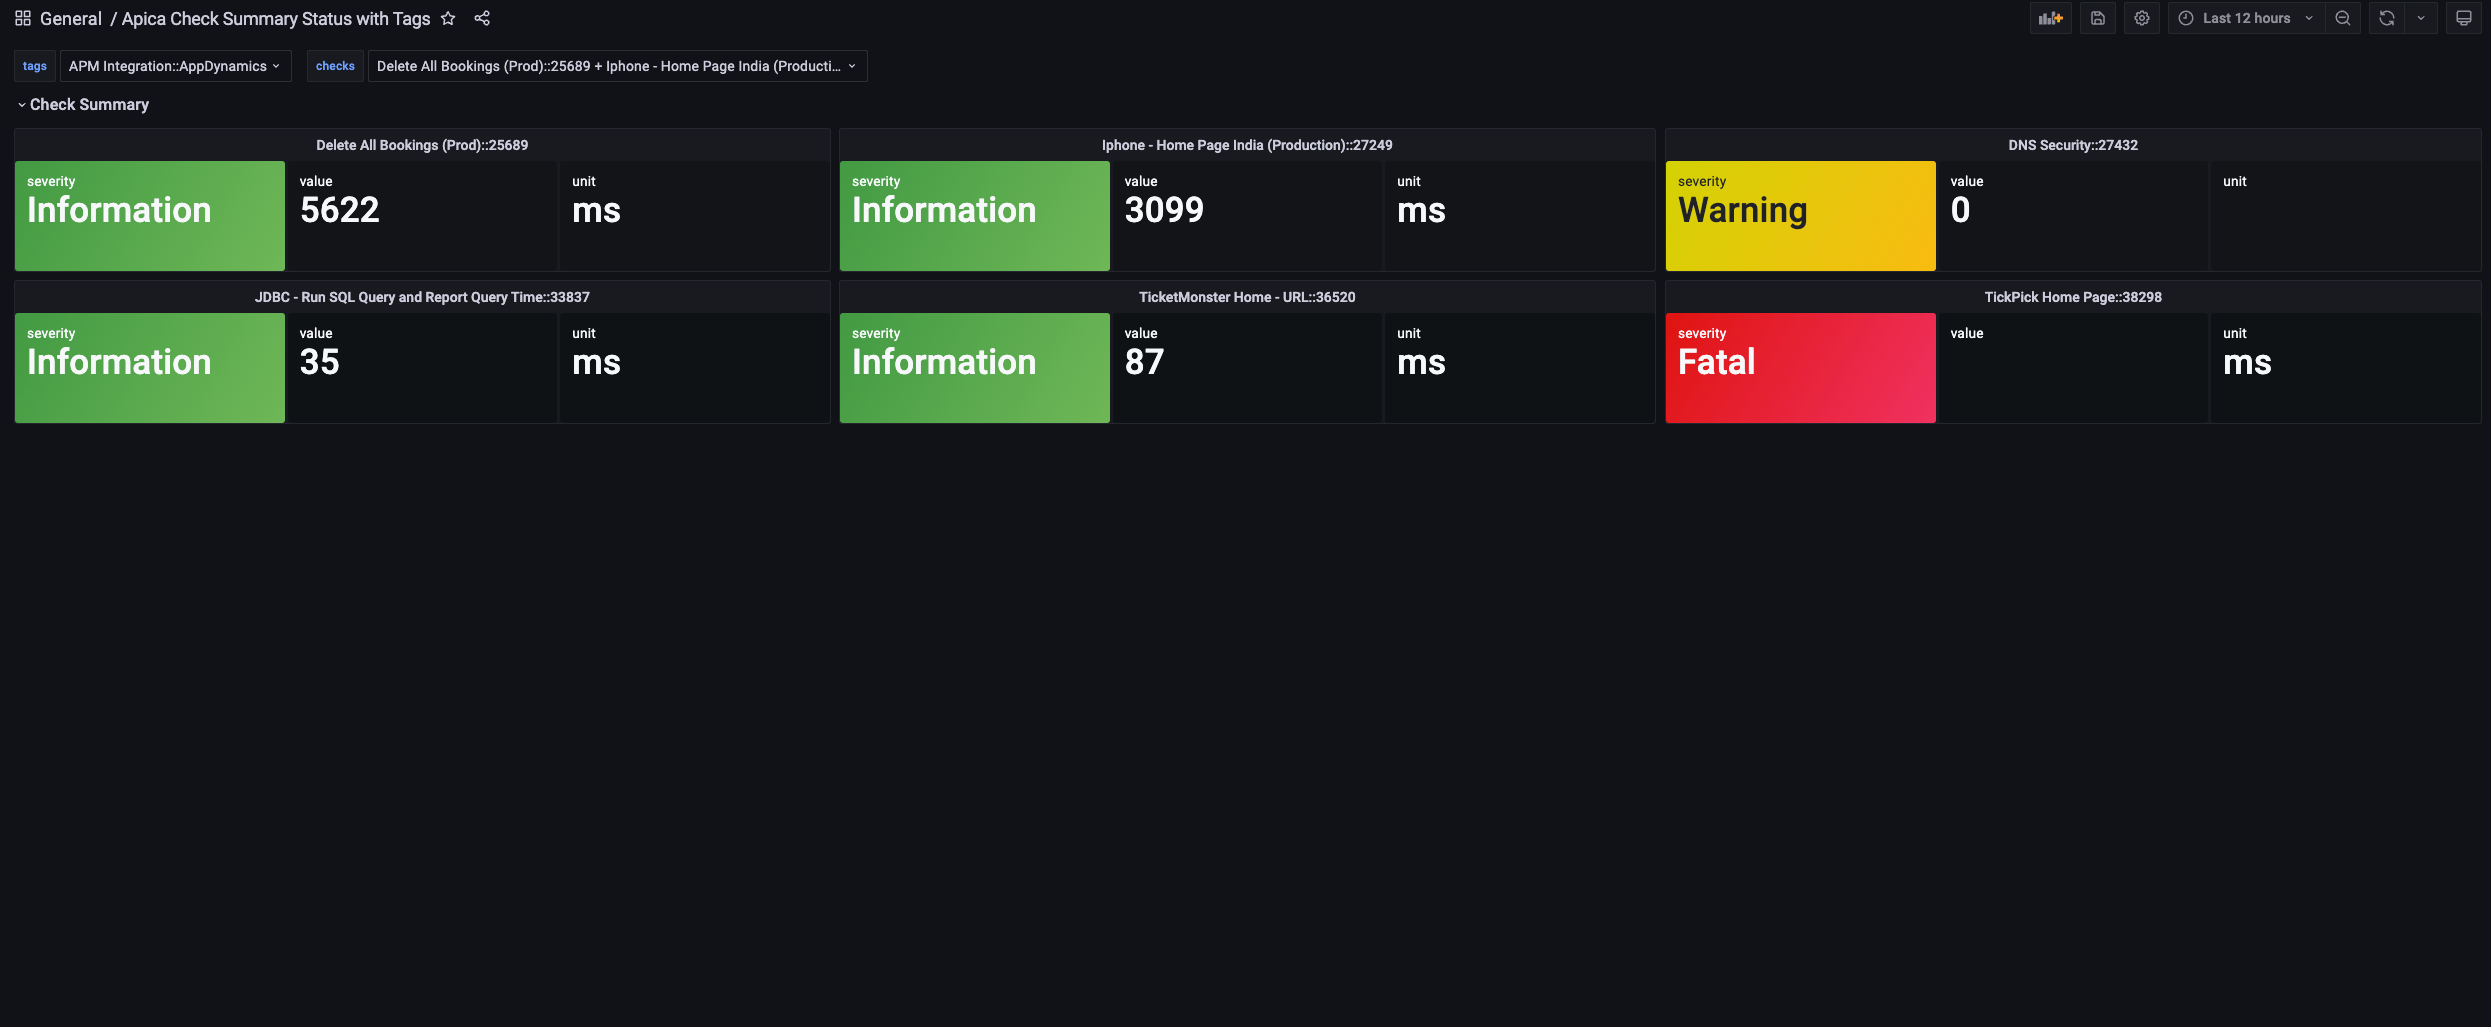
Apica Check Summary Status with Tags
View multiple checks summary health status for selected Tag
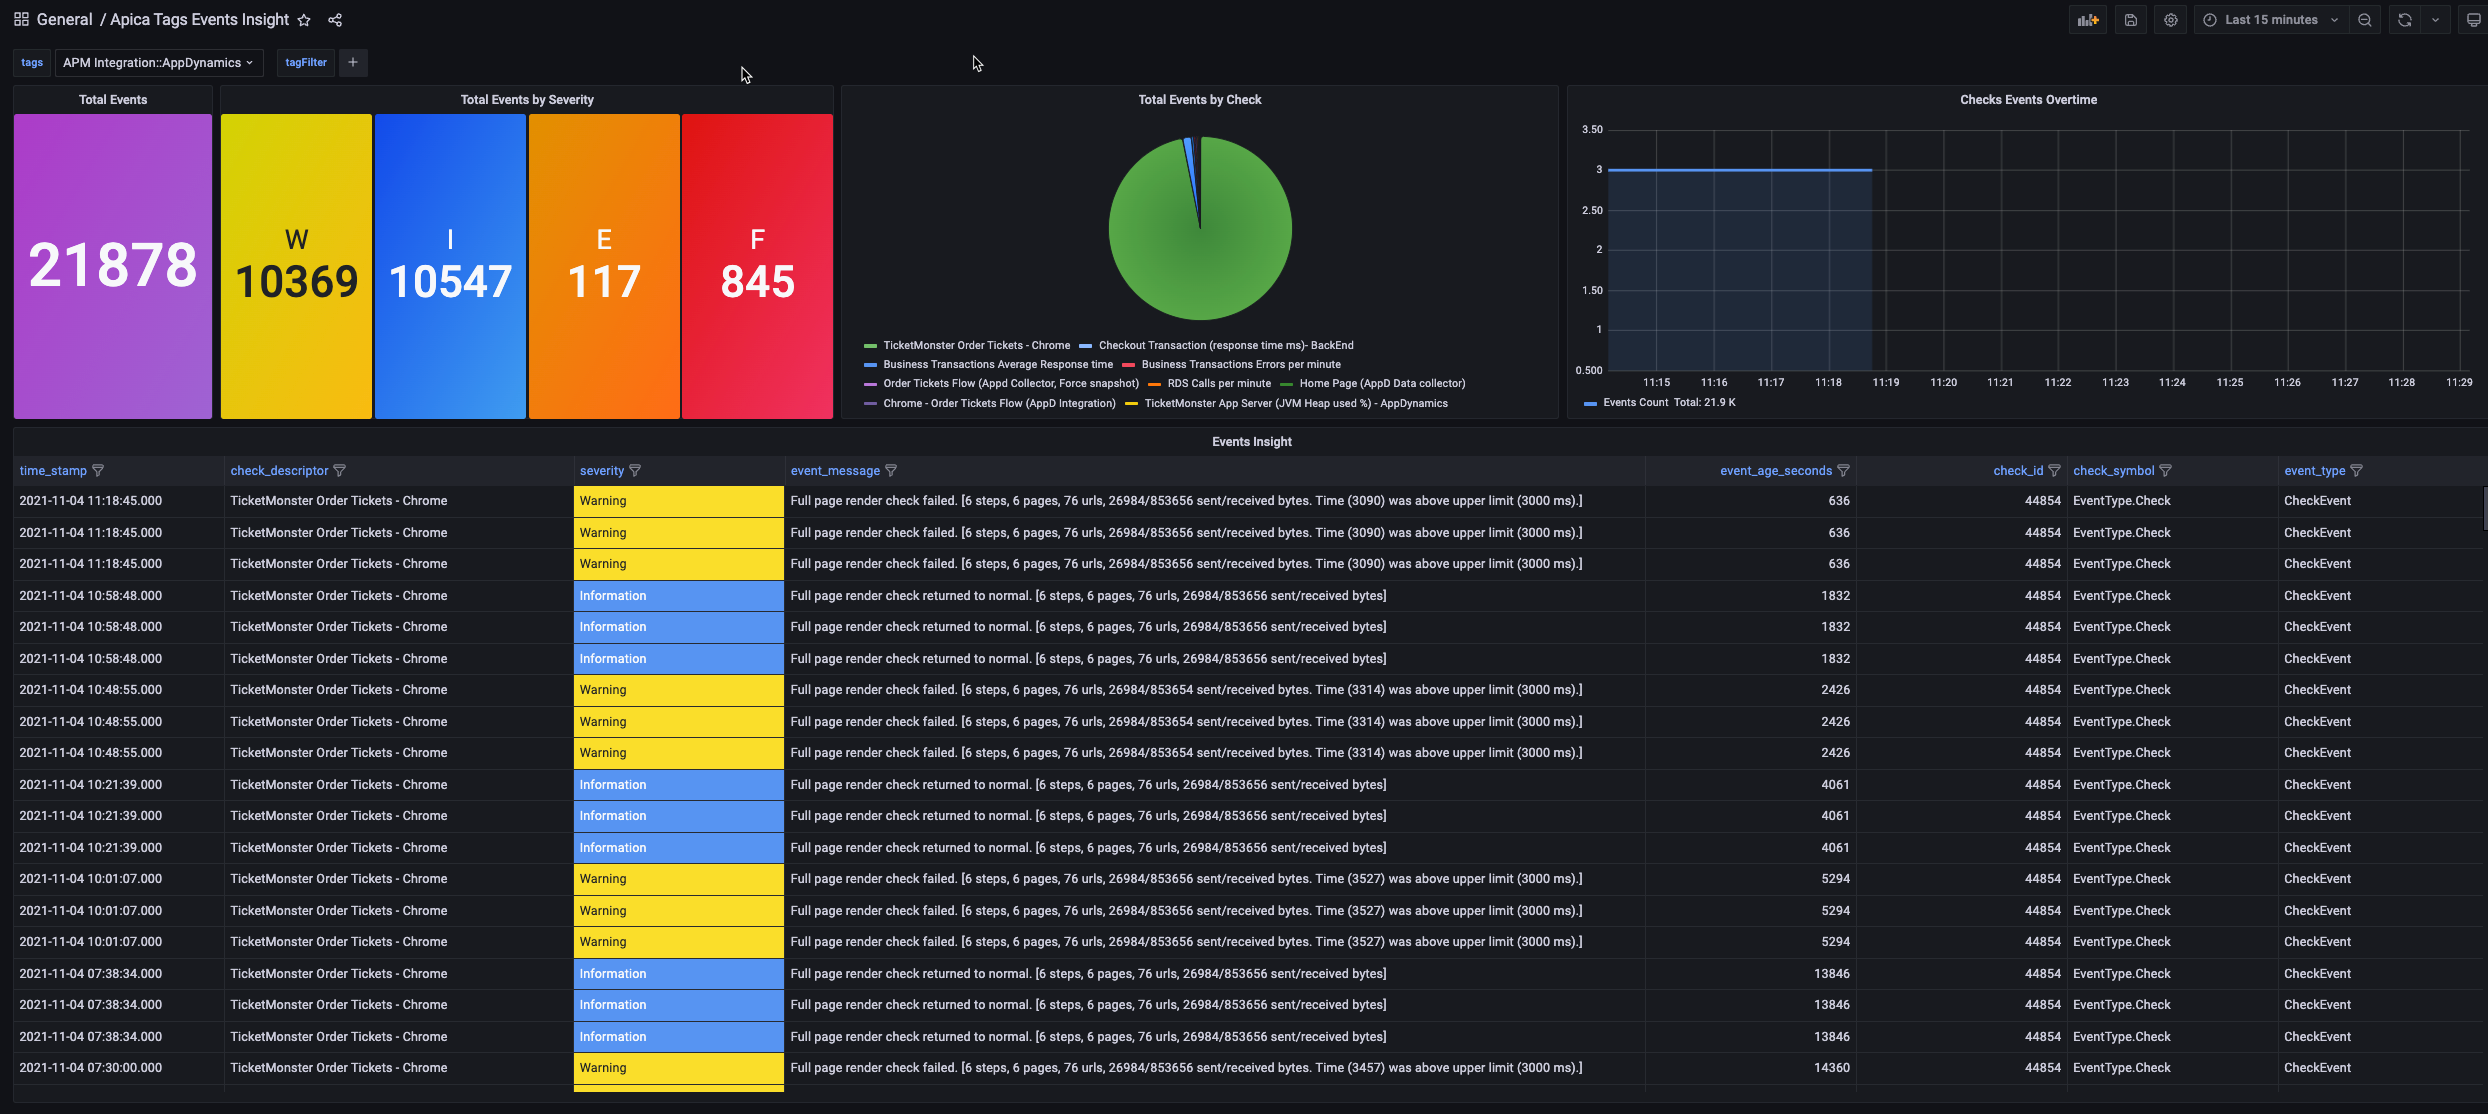
Apica Tags Events Insight
Analyze all events triggered in your Apica system in a selected time for the seleted tag
- Filter the data based on a given tag filter
- Identify the source of noise in the events like the checks that is triggering most of the events. This will lead for better tuning and quality monitoring
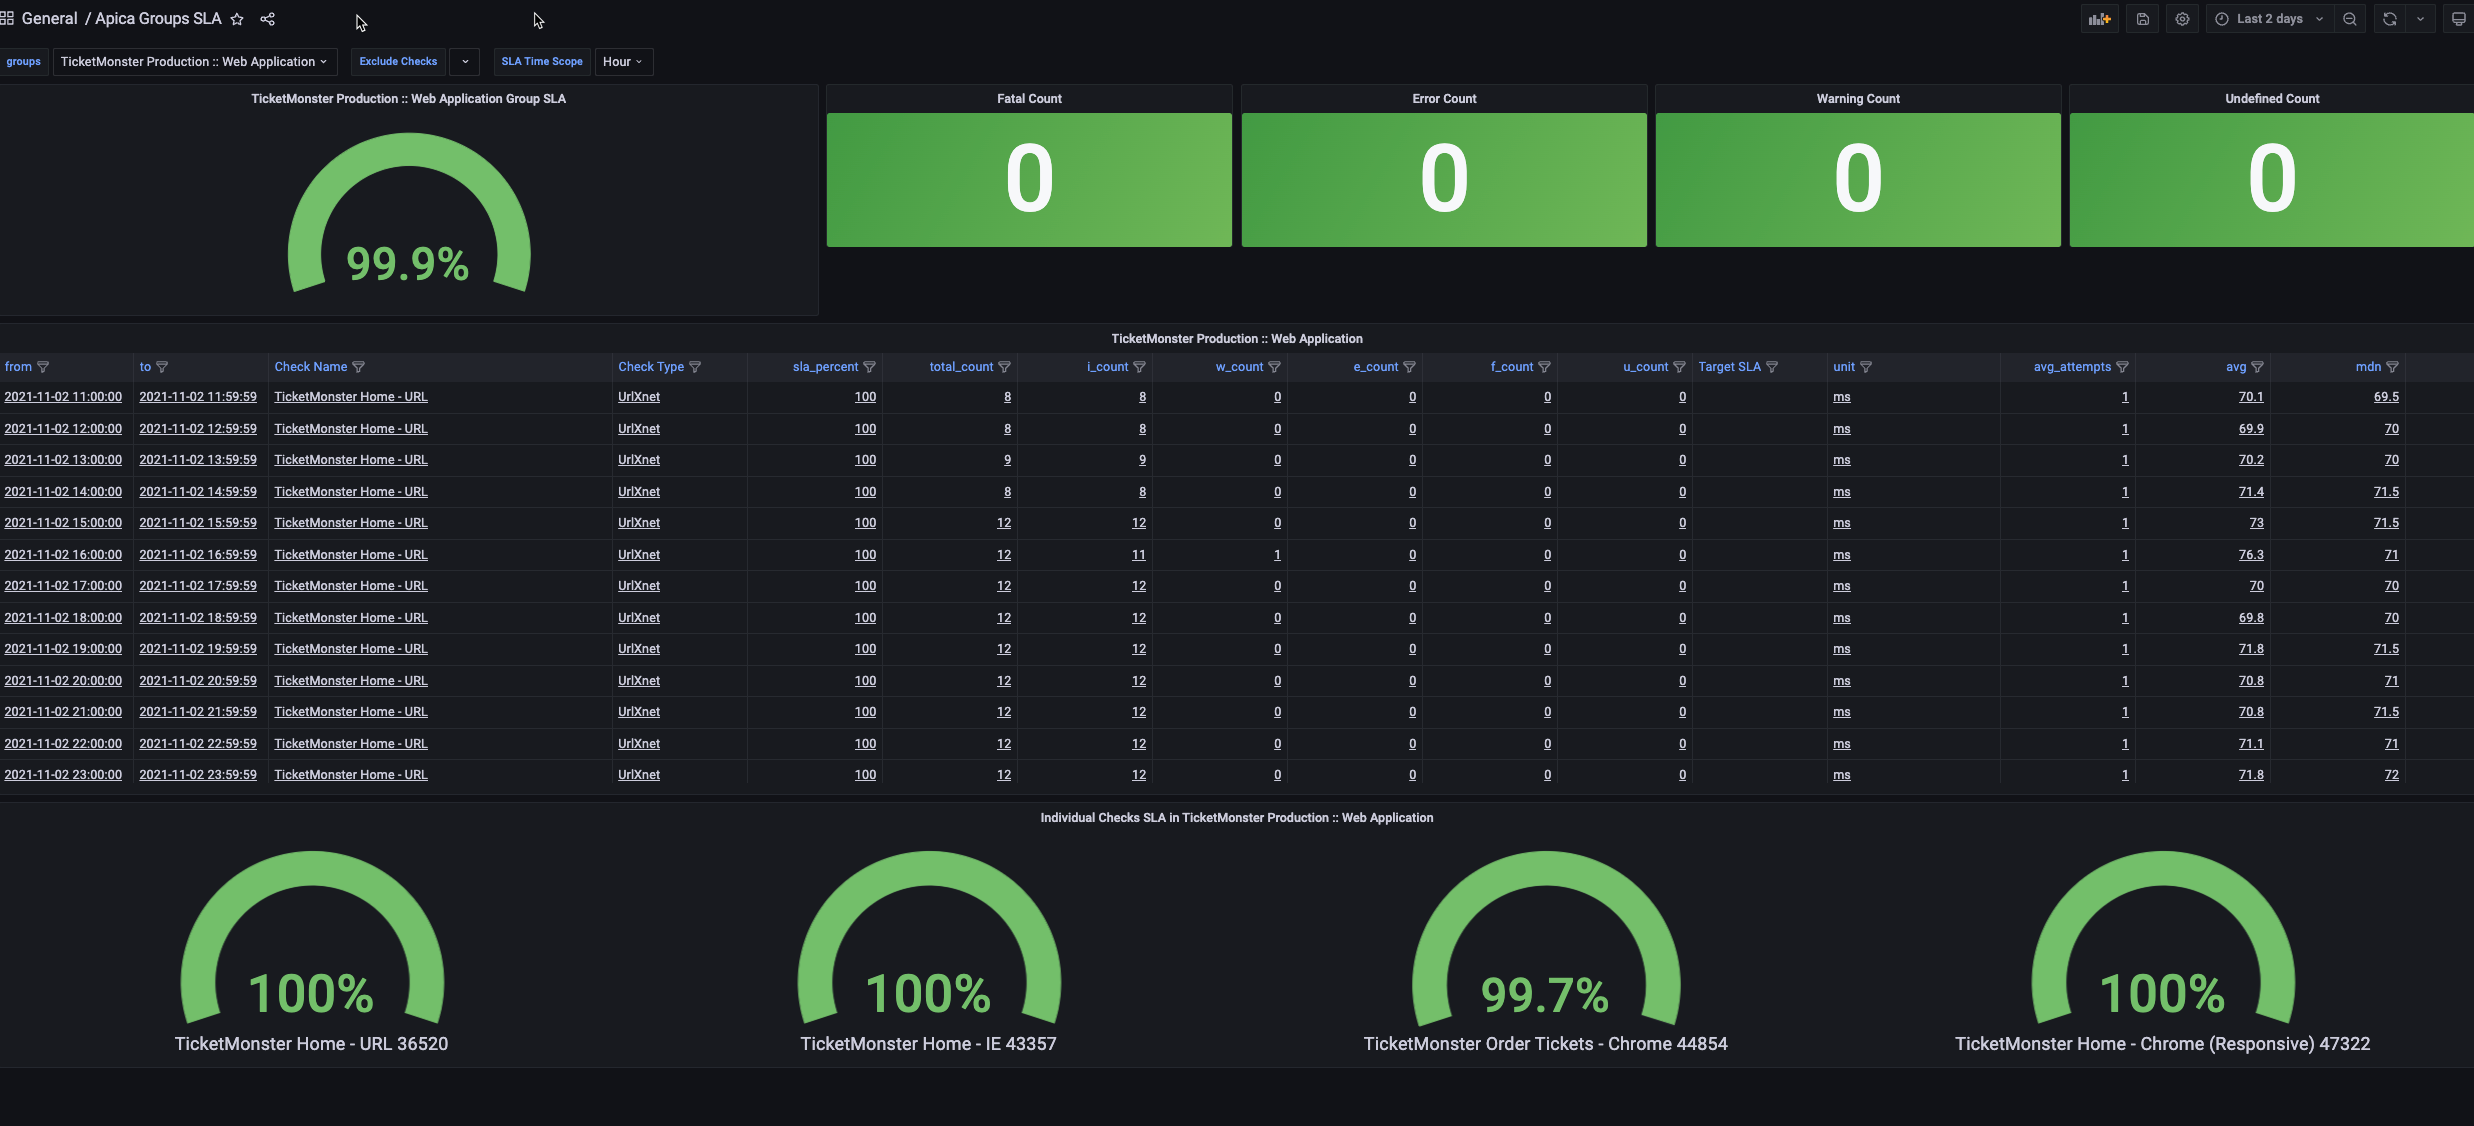
Apica Groups SLA
Dynamic Dashboard to show group Checks SLA
- Show Aggregated SLA at the Group Level
- Show individual checks Aggregated SLA
- You can exclude specific checks from the SLA calculation
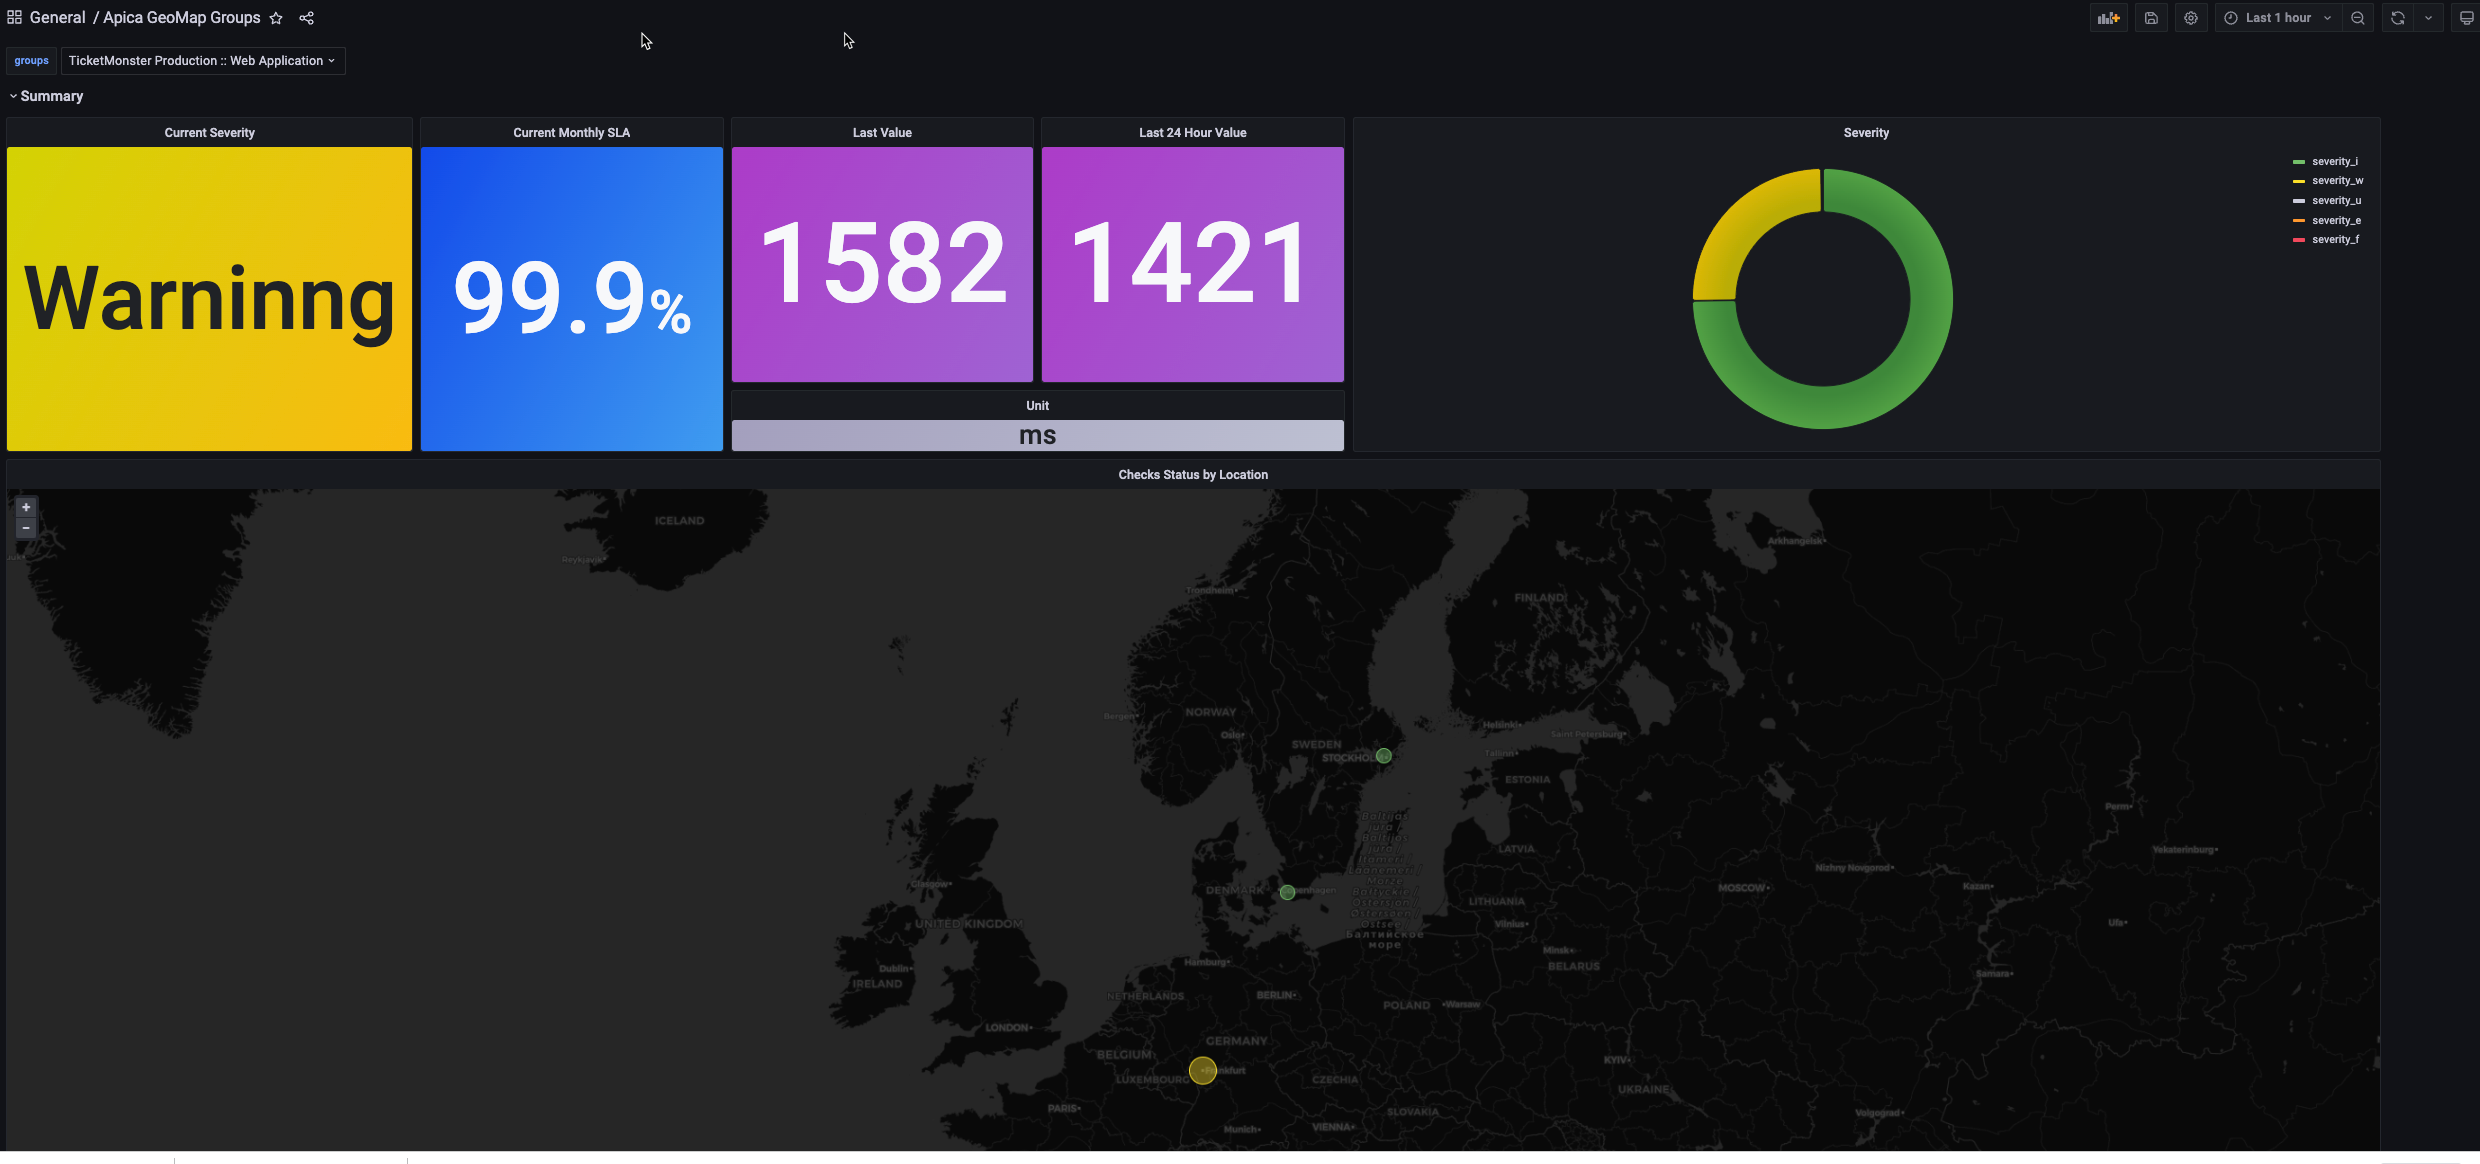
Apica GeoMap Groups
Dynamic Dashboard to show group checks based on geo location
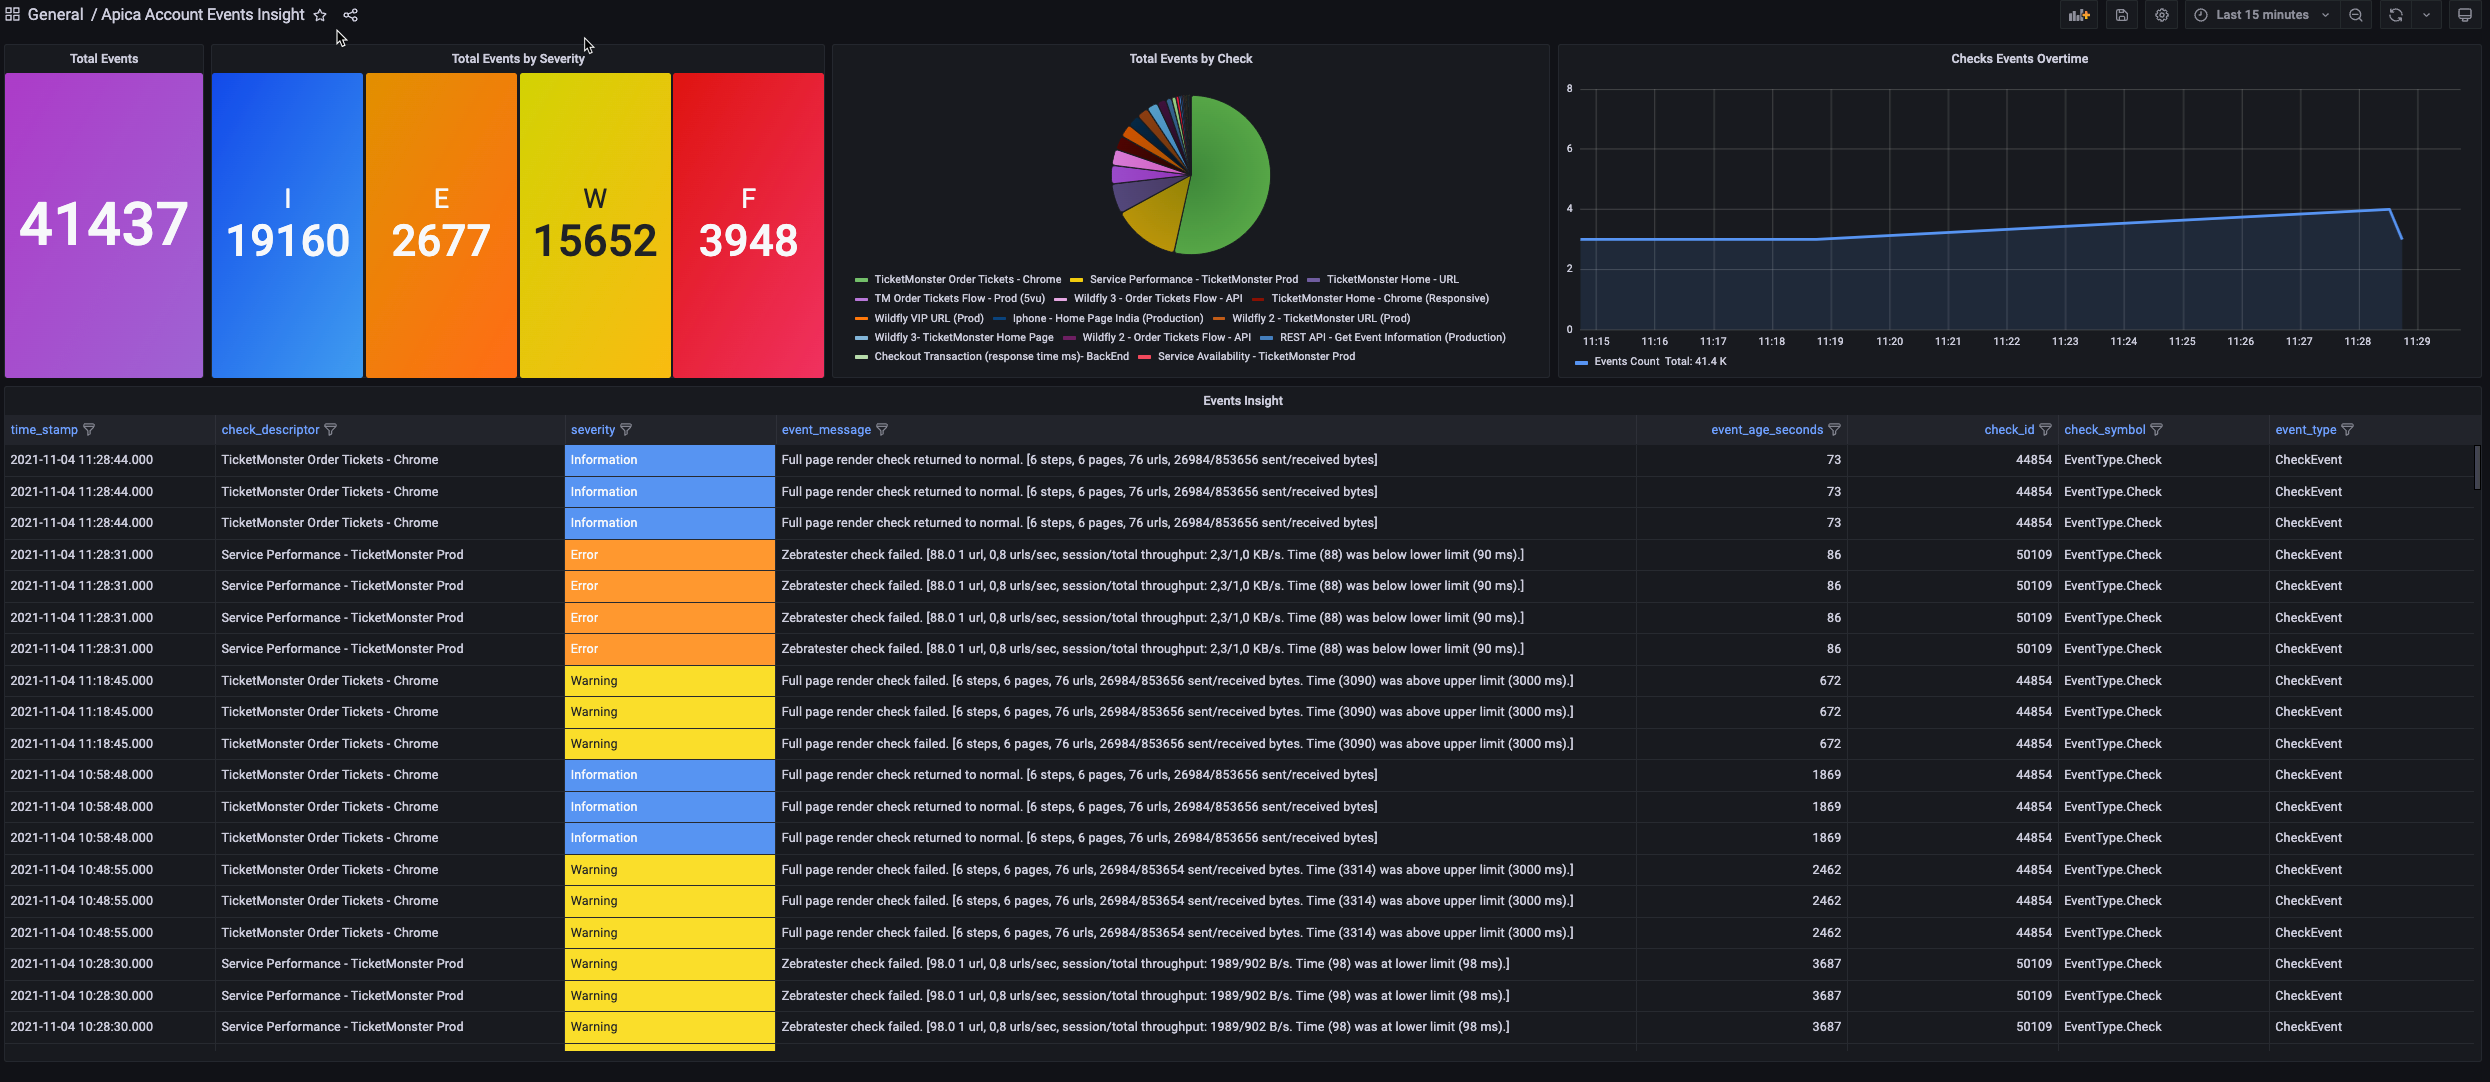
Apica Account Events Insight
Analyze all events triggered in your Apica system in a selected time
- This dashboard is at the account level
- Identify the source of noise in the events like the checks that is triggering most of the events. This will lead for better tuning and quality monitoring
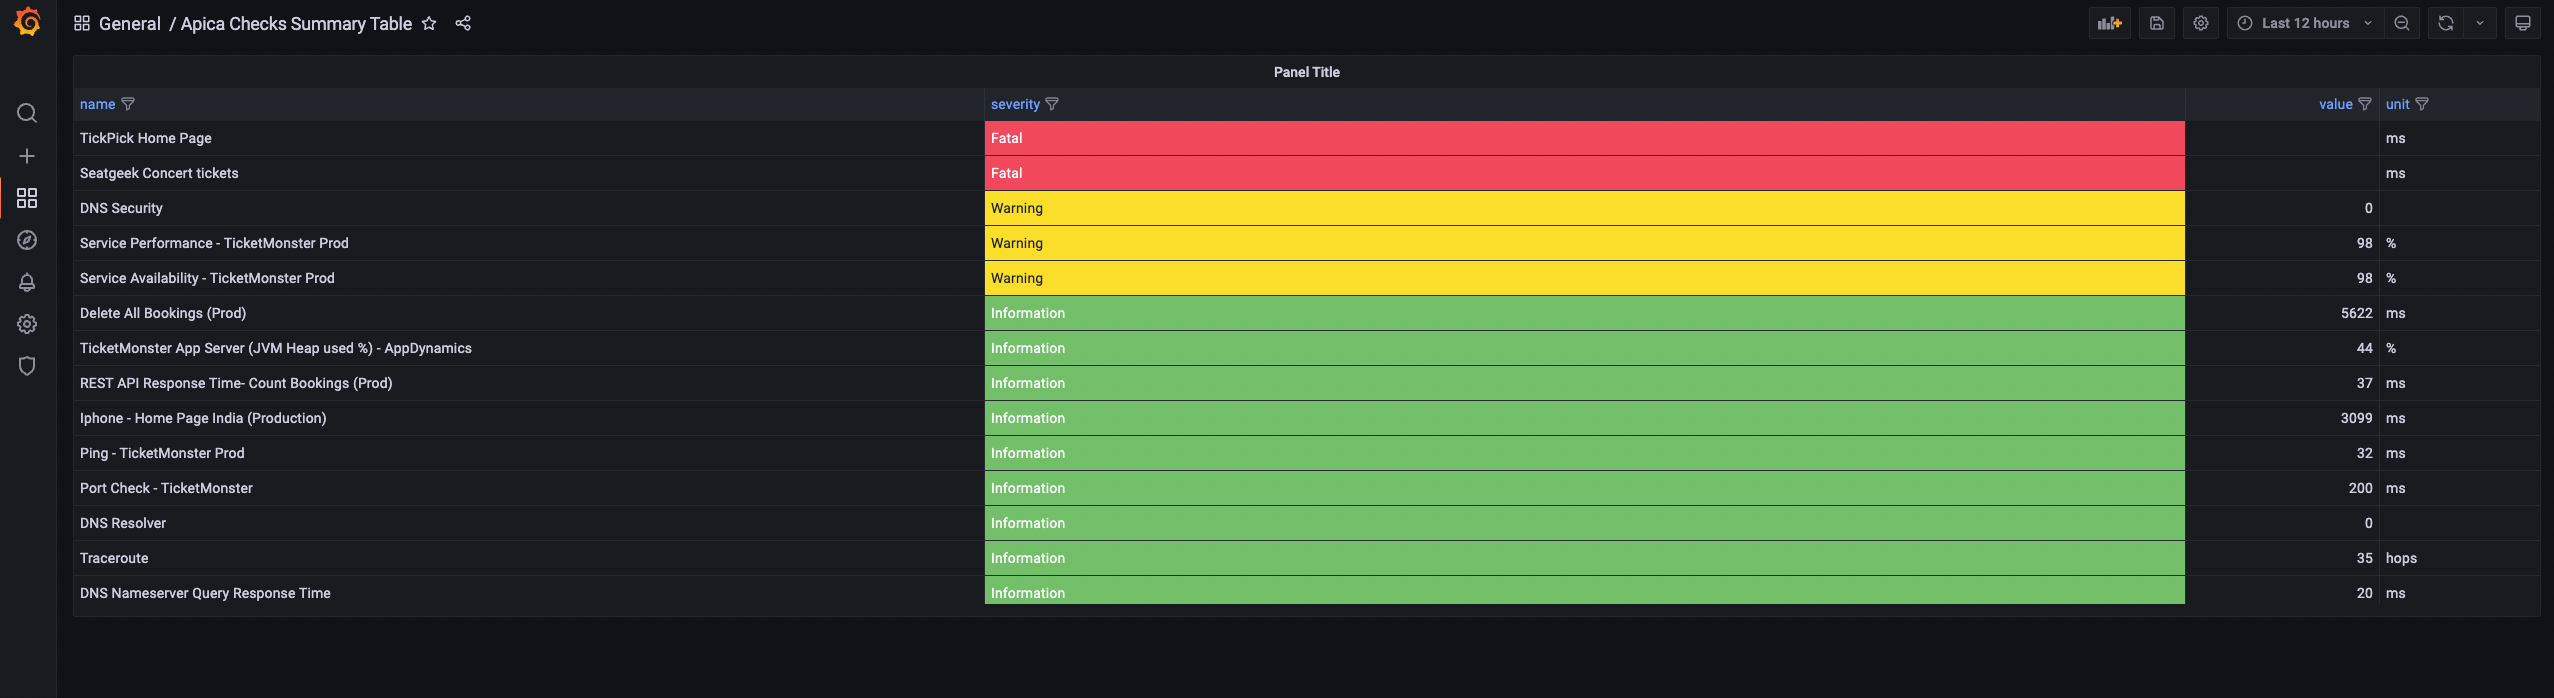
Apica Checks Summary Table
View accounts checks summary health status in table format at the account level
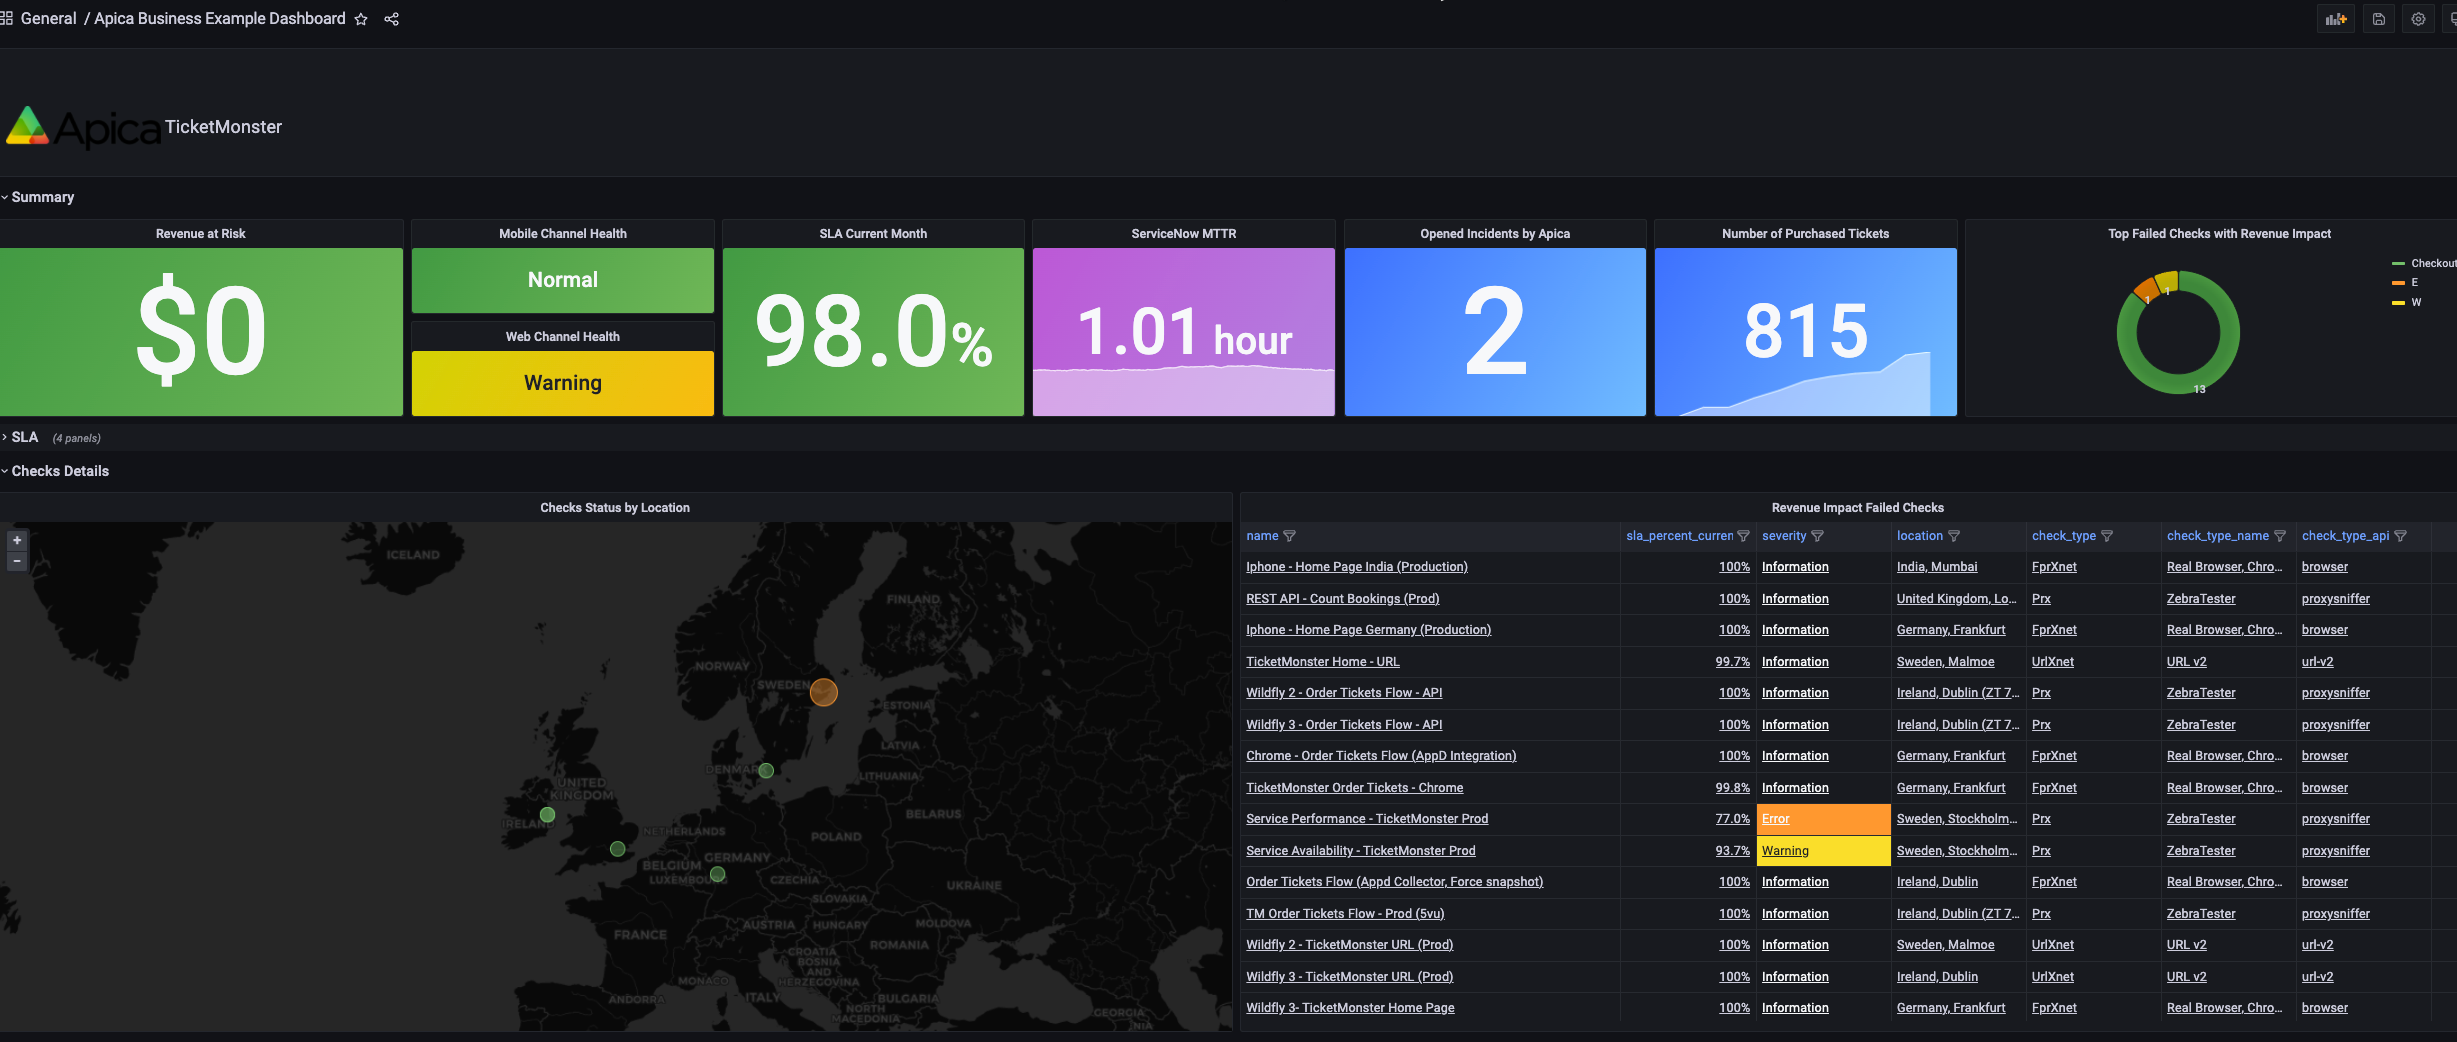
Sample Business Dashboard
Sample dashboard to demonstrate business impact by using Apica Synthetic Monitoring
- This is a static dashboard so you will need to adjust and customize for your environment
- This dashboard to be used as a template
Template Variables
The plugin supports template Variables that allows you to create more interactive and dynamic dashboards. Instead of hard-coding things like tag, group, and check in your metric queries, you can use variables in their place. Variables are displayed as dropdown lists at the top of the dashboard. These dropdowns make it easy to change the data being displayed in your dashboard. Variables can be used in titles, descriptions, text panels, and queries. Queries with text that starts with $ are templates
For more information please see the Grafana docs https://grafana.com/docs/grafana/latest/variables/
| Name | Description | Namespace | Query |
|---|---|---|---|
| tags | List all tags configured on the Apica System | tags | |
| groupByCategory | This variable is used to list all tag keys which are used in the group by category list | tagsKeys | |
| scopeOption | This variable is used to list scope options which are ) used in the Aggregate Queries. The return values are: (Hour,Day,Week,Month,Year) | scopeOptions | |
| checks | This variable is used to list apica checks. The checks can be filtered also based on tags by providing the tags variable name in the query section | checks | $tags |
| groups | List all groups configured on the Apica System | groups | |
| groupChecks | This variable is used to list apica checks for a specified group in the query input | groupChecks | $groups |
Ad hoc filter
Ad hoc filters allow you to add key/value filters that are automatically added to all metric queries that use the specified data source. Unlike other variables, you do not use ad hoc filters in queries. Instead, you use ad hoc filters to write filters for existing queries. https://grafana.com/docs/grafana/latest/variables/variable-types/add-ad-hoc-filters/
The Apica plugin supports ad hoc filter in the tag level queries as a tag filter. For example, if you need to query all aggrgate data from a selected tag where environment = prod. To reference the tag filter ad hoc variable you create in your dashboard, you have to use the $adhoc key work as the value for the “Filter by Tag Expression” field in the Query Editor
The Ad hoc filter supports Grafana operations (=,!=,=~,~!). Note that (=~,~!) allows you to do regex matching
Query Editor Options
The plugin supports multiple options to Query from the Apica system as detailed in this section. Screenshot below shows the list of Query Types. There are common fields in the query editor based on your selection
- Level: A list that allows the user to select at which level the query will run. The options in this list can be [account, tag, group, check] based on the Query Category type
- Group: A list that allows you to select the Apica group that your query will run against
- Tag: A list that allows you to select the Apica tag that your query will run against
- Checks: A list that allows you to select the Apica Check that your query will run against
- Filter by Tag Expression: This is used by the Ad hoc filter and only available at the Tag Level queries only
- Filter Check by: This is used by the Check Level Query to filter the list of checks that you will select from in the Query Editor. You can filter the returned checks list using [Account, Tag, Group]
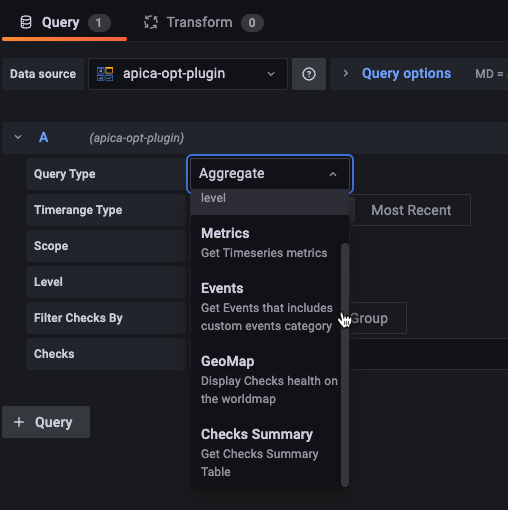
Aggregate
- Gets aggregated data and SLA for Check, Group, or Tag
- Query Supported Levels: [Tag, Group, Checks]
- Used Apica API: https://api-wpm2.apicasystem.com/v3/help#href-ChecksAggregated
| Filed Name | Description | Options | Additional Info |
|---|---|---|---|
| Timerange Type | Allows the user to select the aggreate timerange type | (1) Grafana Time Range: gets aggregated data and SLA between two dates. (2) Most Recent: gets aggregated data and SLA for the most recent periods in a scope. (ie 3 days back if the scope is day) |
|
| Scope | String representation of time aggregation scope | [Hour, Day, Week, Month , Year] | |
| GroupBy Tag Category | This option is used if you need to group the aggregate results by a specific key. For example, If you need to Query results by Environment tag value | List of Tag Keys | Available for Tag Level onlyl |
| Exclude Checks | This Query field option is used by the Group Level Query only to allow the use to exclude check(s) from the returned results. For example, if you need to calculate SLA for a given group but you need to exlcude specific checks in the calculated Group SLA | List of Check IDs in the selected Group | Available for Group Level only |
Check Summary
- Gets a list of checks with summary info about check(s), current SLA, last result and its status
- Query Supported Levels: [Account, Tag, Group, Checks]
- Used Apica API:
- Account, Tag, Check: https://api-wpm2.apicasystem.com/v3/Help/Route/GET-checks_enabled_severity
- Group: /checkssummary/groups/
Metrics
- Gets Timeseries data for check results.
- Query Supported Levels: [Check]
- Used Apica API:
- Metrics Summary: https://api-wpm2.apicasystem.com/v3/Help/Route/GET-checks-results
- All Metrics: POST /checks/26743/results/metrics
| Filed Name | Description | Options | Additional Info |
|---|---|---|---|
| Return Result Type | Gives the option to select the type of metrics query to run against the selected check | (1) All Metrics: the user can select from a drop down list the metrics that need to be queies (2) Metrics Summary: This will query the Metrics Summary API that returns multiple metrics that are available for any kind of check like severity, value, result code, message,..etc |
|
| Metric | multi seelction drop down list to select the metric names you need to query and get their results | List of metric names | only available for All Metrics option |
GeoMap
- View checks health status by geo location
- Query Supported Levels: [Account, Tag, Group]
- Used Apica API: /checkssummary/locations
Grafana GeoMap Settings
You need to make sure to define the GeoMap options in order to render the data from this Query in the Grafana Geomap Marker Color: You can define the marker color based on the “Highest Severity” Field Marker Size: You can define the marker size based on the “Impacted Checks Count”
Events
- Analyze all events triggered in your Apica system for any given time that includes both Custom Events and normal events
- Query Supported Levels: [Account, Tag, Check]
- Used Apica API:
- All Events: GET /events
- Custom Events: GET /custom_events
Annotations
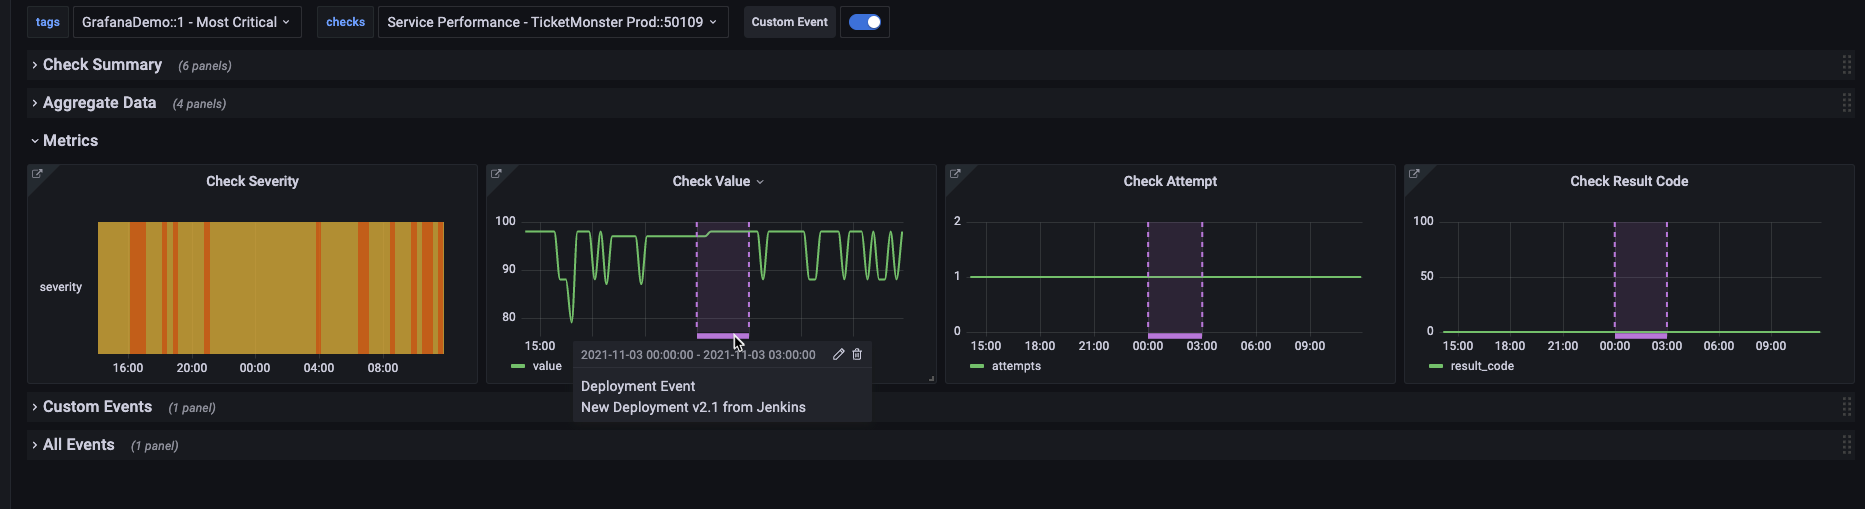
The plugin supports annotations by overlaying events like custom events on top of the graphs. When you hover over an annotation you can get the event description.
For example the screenshot below shows a custom event for a deployment that happened on the highlighted time range as annotation
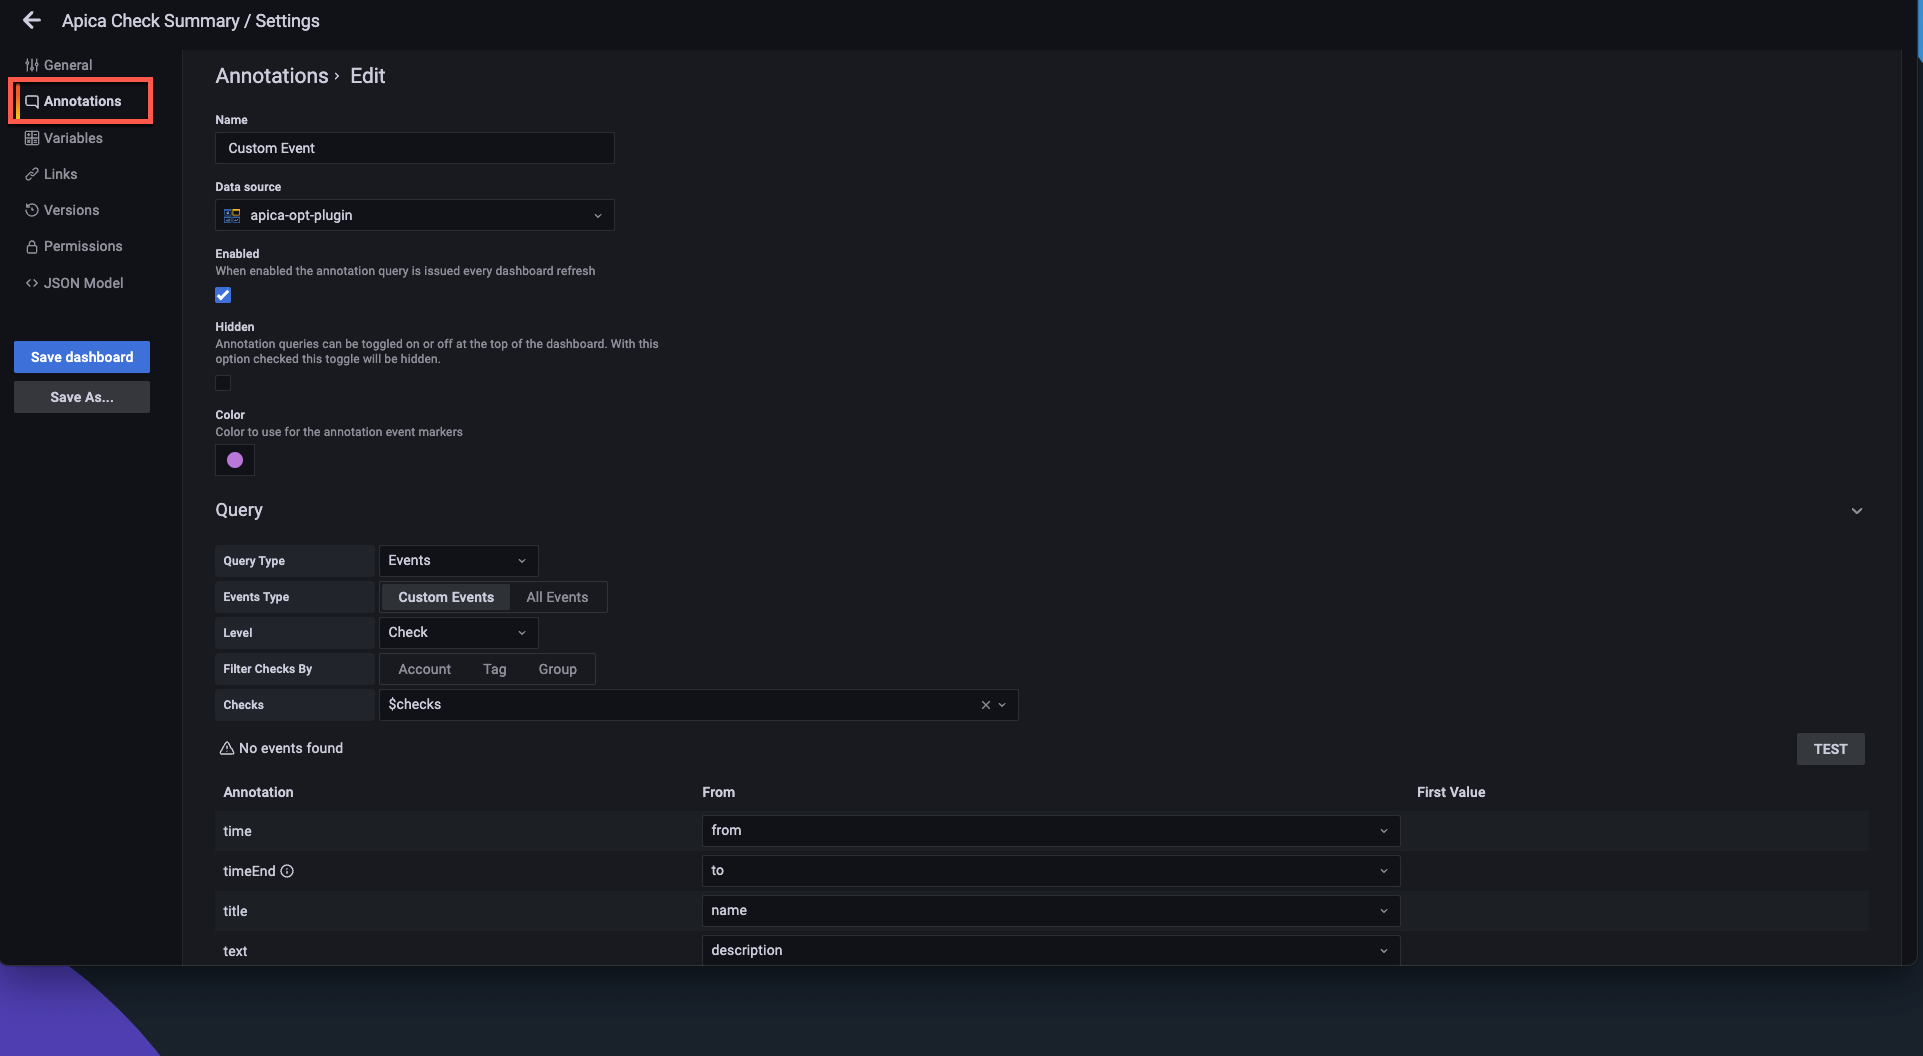
The annotation show custom events was configured as below
How to Build and Configure Dashboards
Example: Dynamic Dashboard with template variables and ad hoc filter
This video will show an example of how to build a dynamic dashboard like the Tags SLA in a step by step
Example: Custom Dashboard
In some scenarios you might need to build a custom dashboard for a specfic checks, tags, or groups. The plugin also supports selecting your data from the Query Editor without relying on template variables. In this video we will build